NEW!
CSHTML5 has now become OpenSilver!
We are happy to announce that CSHTML5 has been significantly improved and rebranded
to 'OpenSilver', which stands for 'Open-source reimplementation of Silverlight'. It is fully backward compatible and it can be downloaded from
OpenSilver.net. Upgrading from
CSHTML5 to OpenSilver is very easy.
Read the FAQ

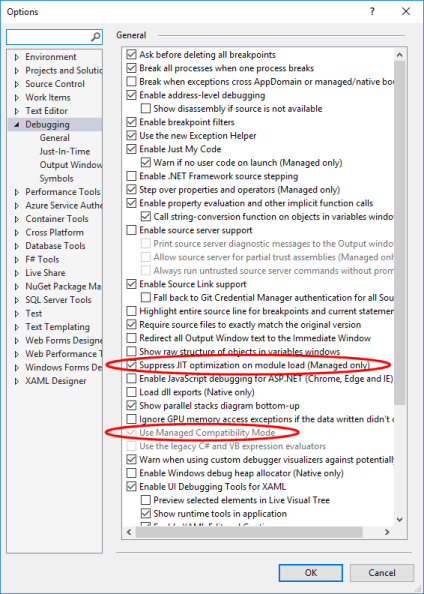
If you are using version 2.x of CSHTML5, please check the options "Suppress JIT optimization on module load (Managed only)" and "Use Managed Compatibility Mode" in the Visual Studio options (menu "Tools" => "Options" => "Debugging" => "General"), as shown in the following screenshot:
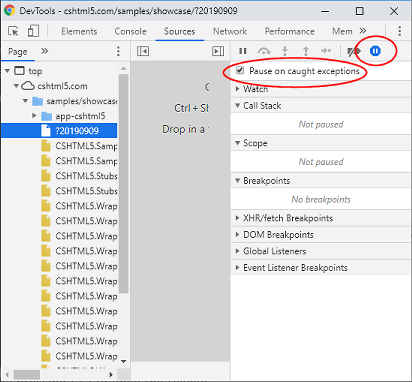
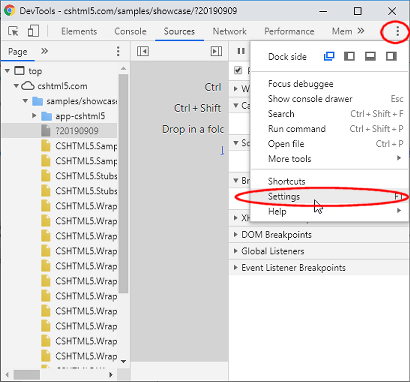
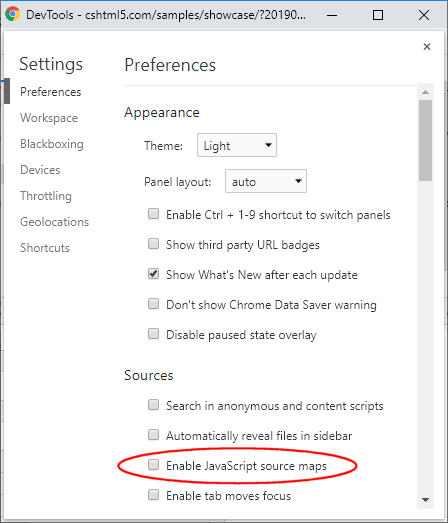
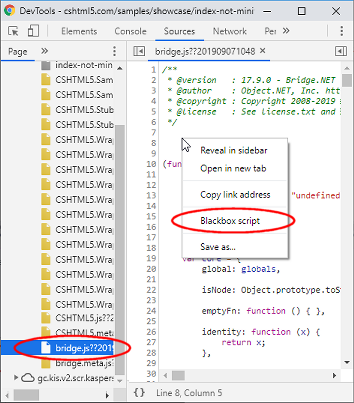
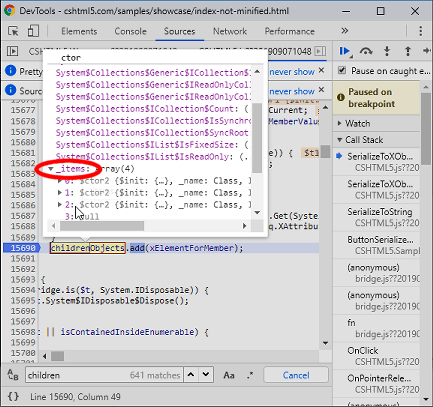
You can debug in the browser by pressing F12 to open the Developer Tools.
For the best debugging experience, we recommend you to:
For any question, please post a message on the forums or contact us.
 follow us on
twitter
follow us on
twitter
 find us on
facebook
find us on
facebook
 be active on the
forums
be active on the
forums
 view source on
GitHub
view source on
GitHub